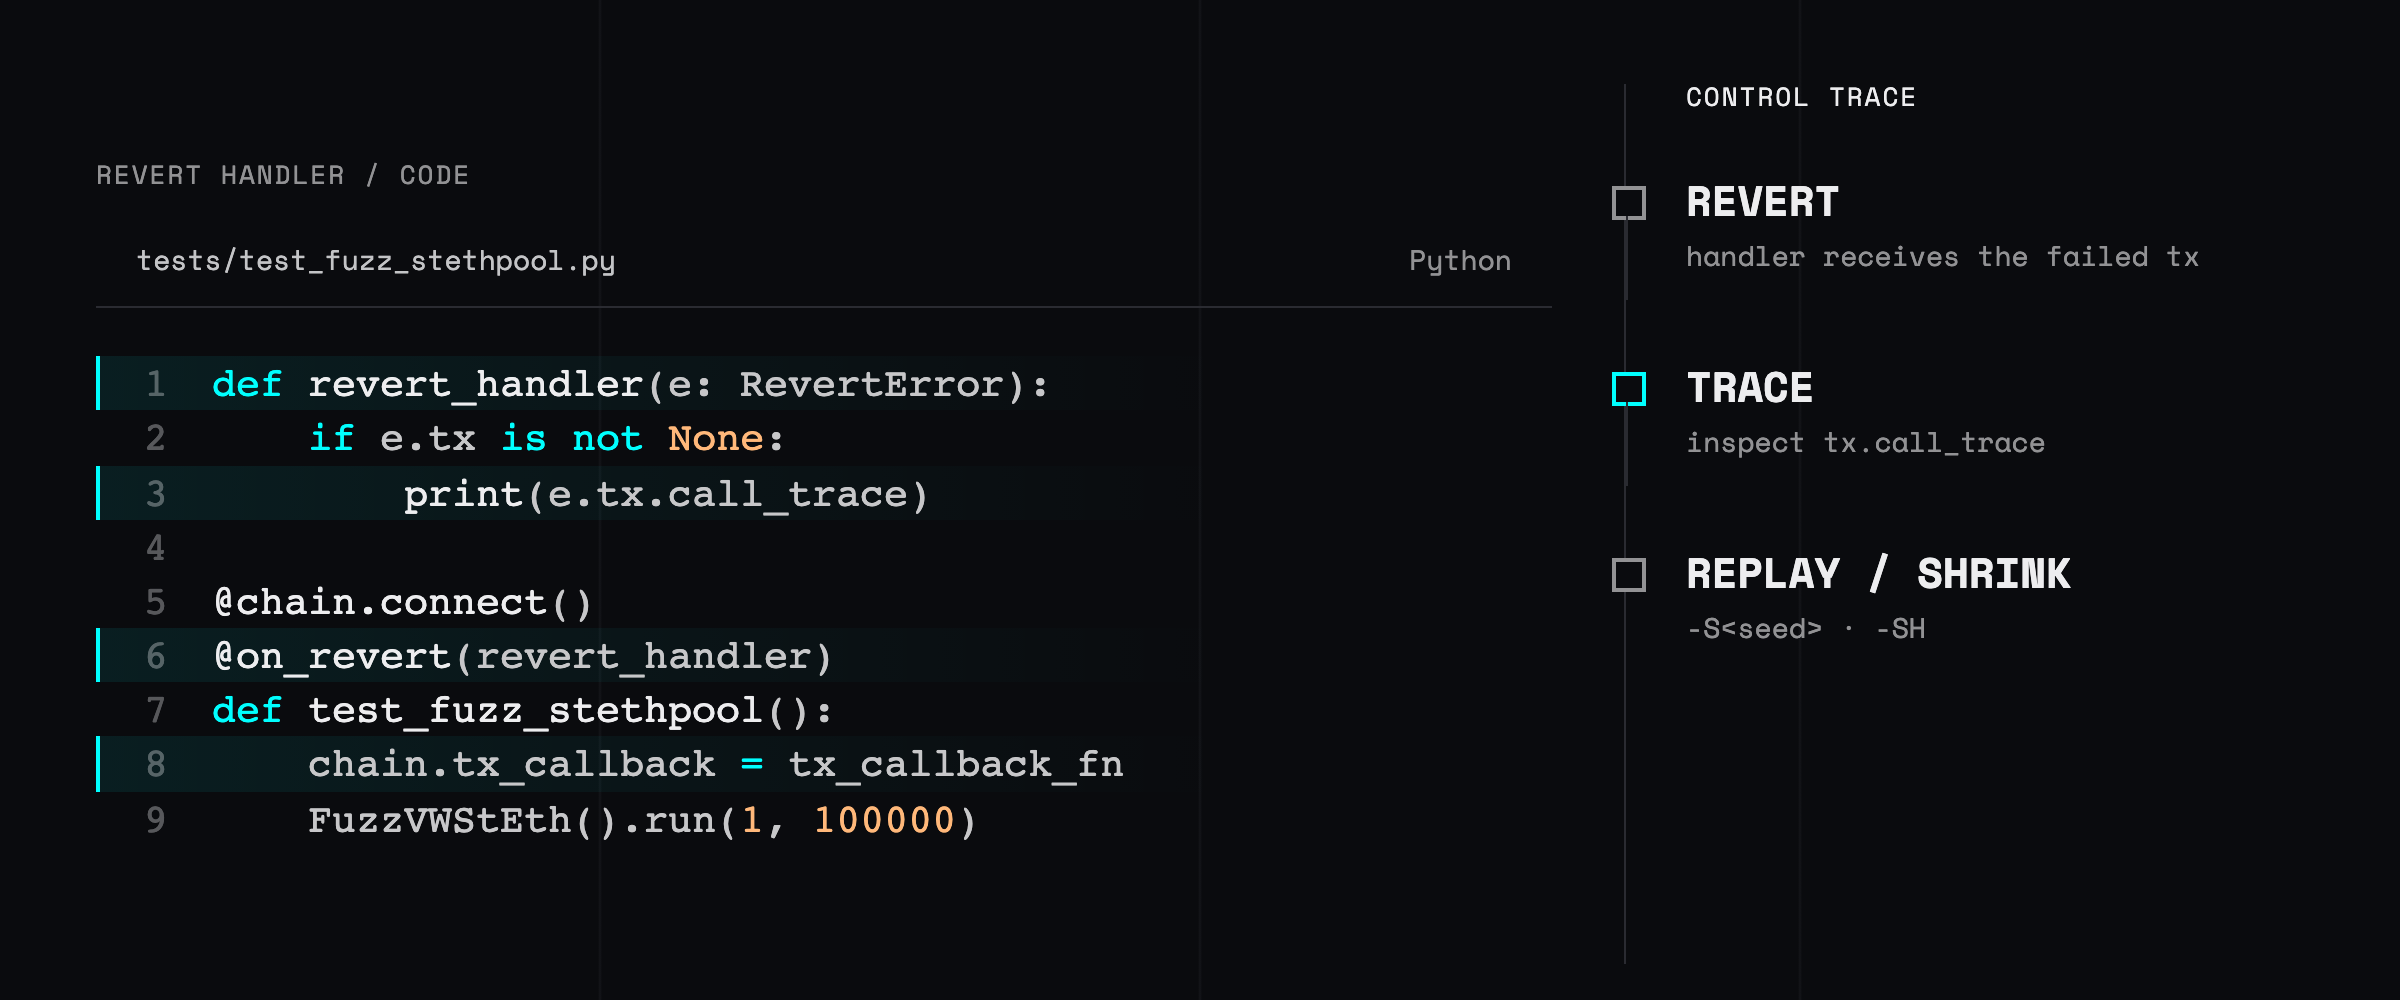
Master Wake's debugging tools: console logging, Python fuzzing, ipdb integration, and performance profiling for Solidity smart contract development.
Glossary definition
The ordered record of calls, returns, events, and failures produced during a transaction's execution.
A call trace exposes the execution path of a transaction: which contracts and functions ran, the values they received, and where a revert or unexpected state change occurred. Readable labels make traces substantially faster to inspect.
Traces are debugging evidence, not a complete security verdict. They show one execution path; tests and analysis still have to explore the paths that did not run. Wake exposes transaction call traces directly from Python tests and can label accounts so a trace reads as a sequence of actors rather than addresses.
Used in context
Master Wake's debugging tools: console logging, Python fuzzing, ipdb integration, and performance profiling for Solidity smart contract development.
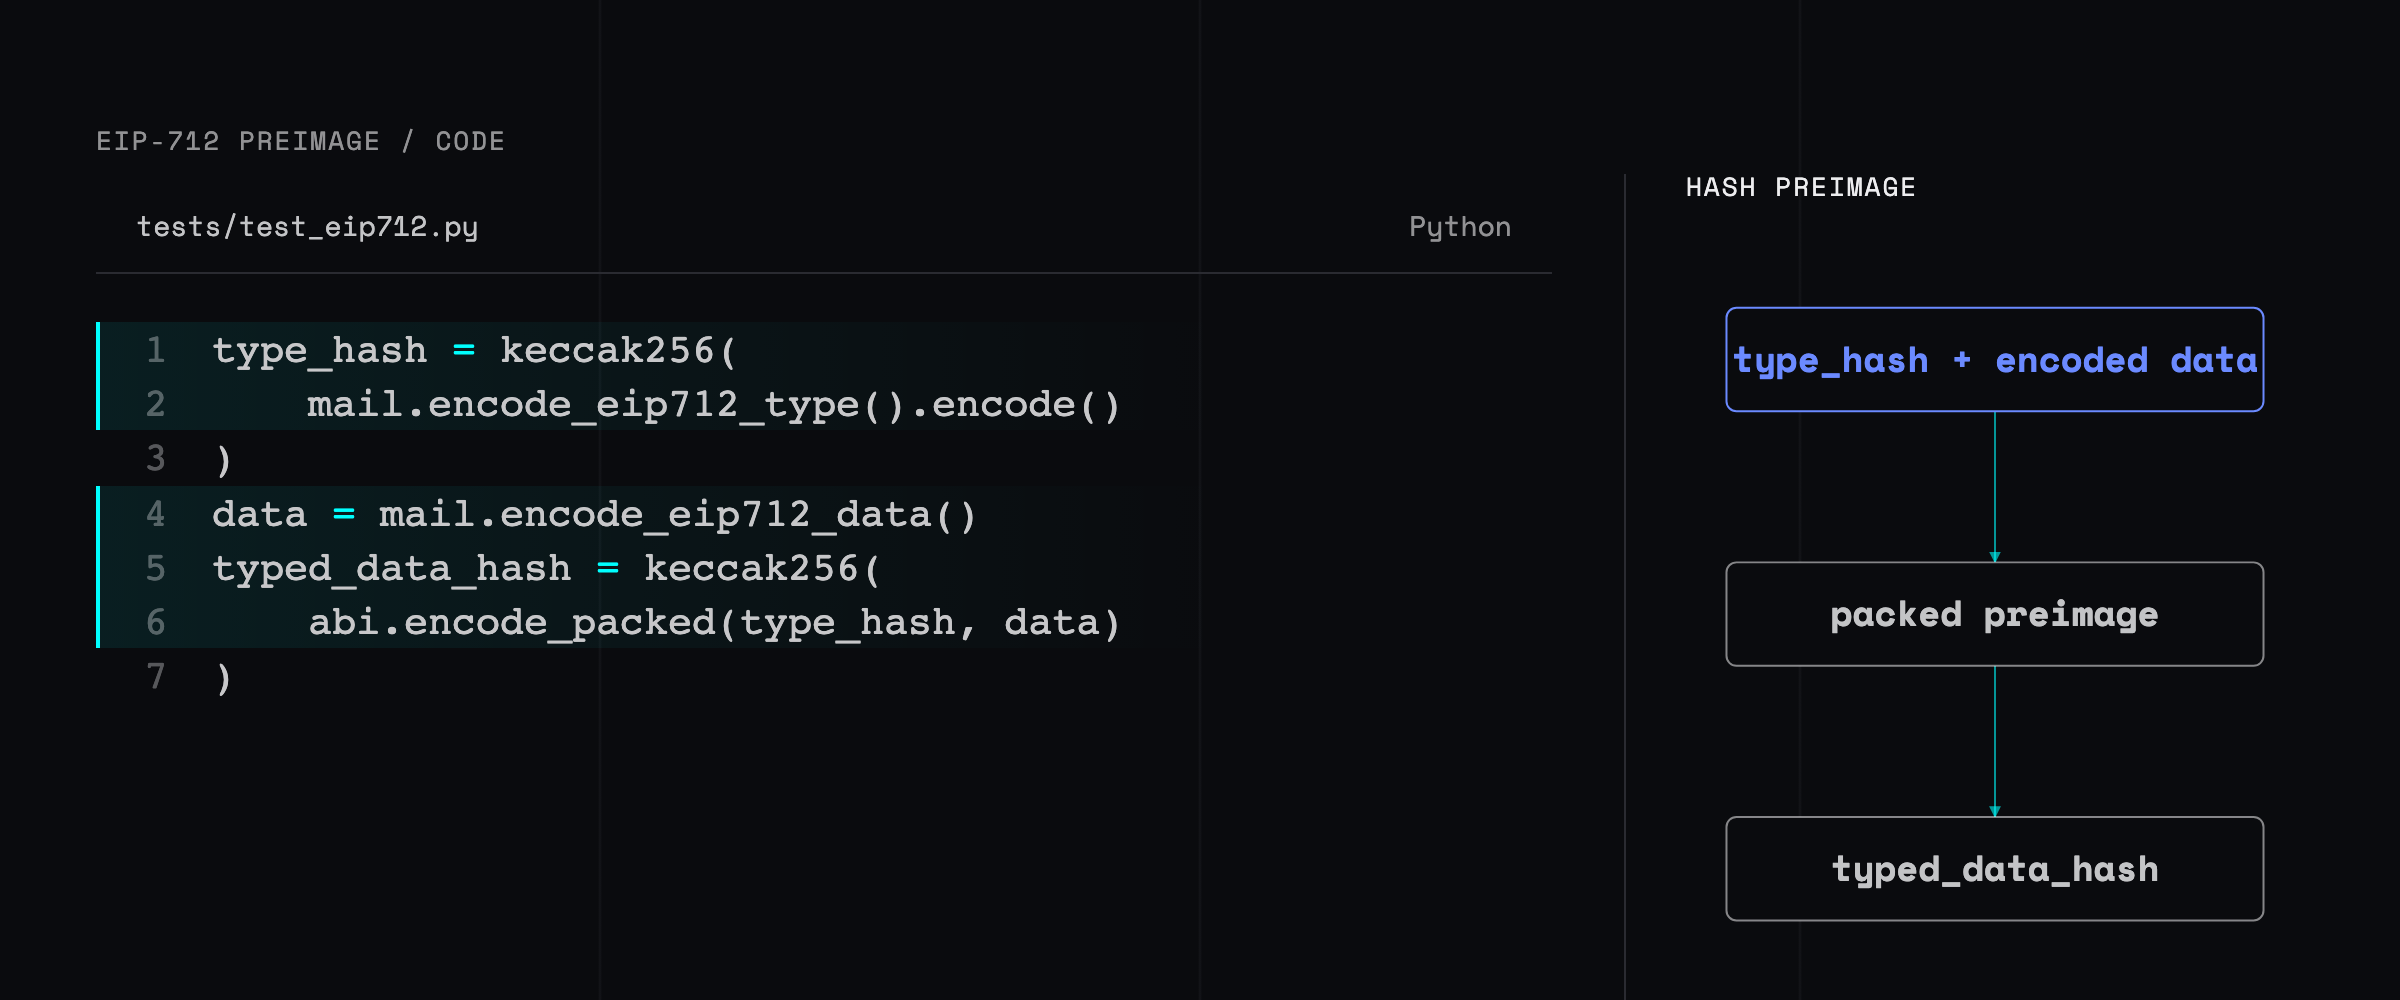
Inspect EIP-712 type strings and preimage bytes in Wake to match Solidity exactly, catch schema errors early, and prove signatures before deployment.
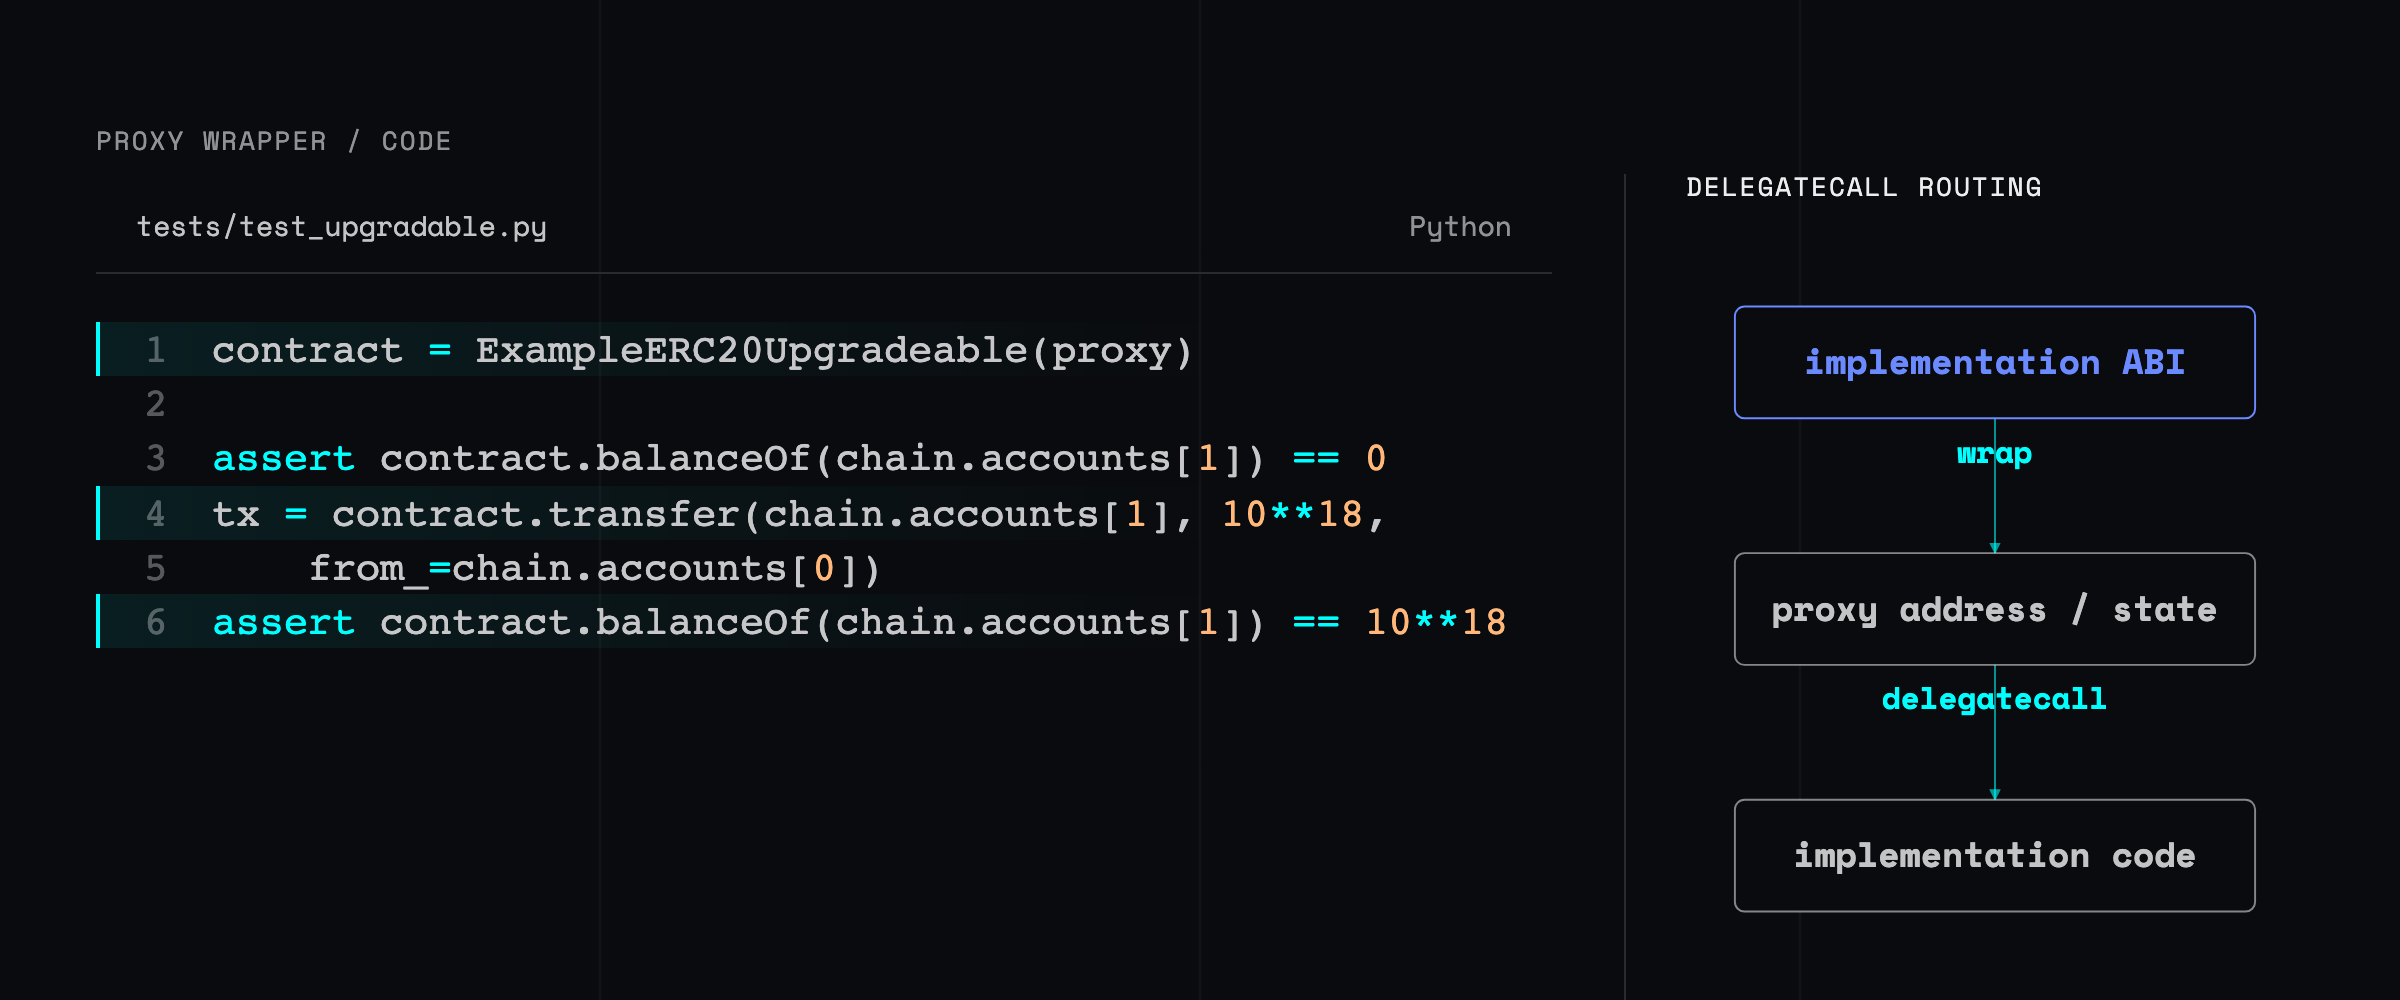
Test upgradable proxy contracts in Wake's Python framework. Catch initialization bugs, storage collisions, and access control issues before mainnet.
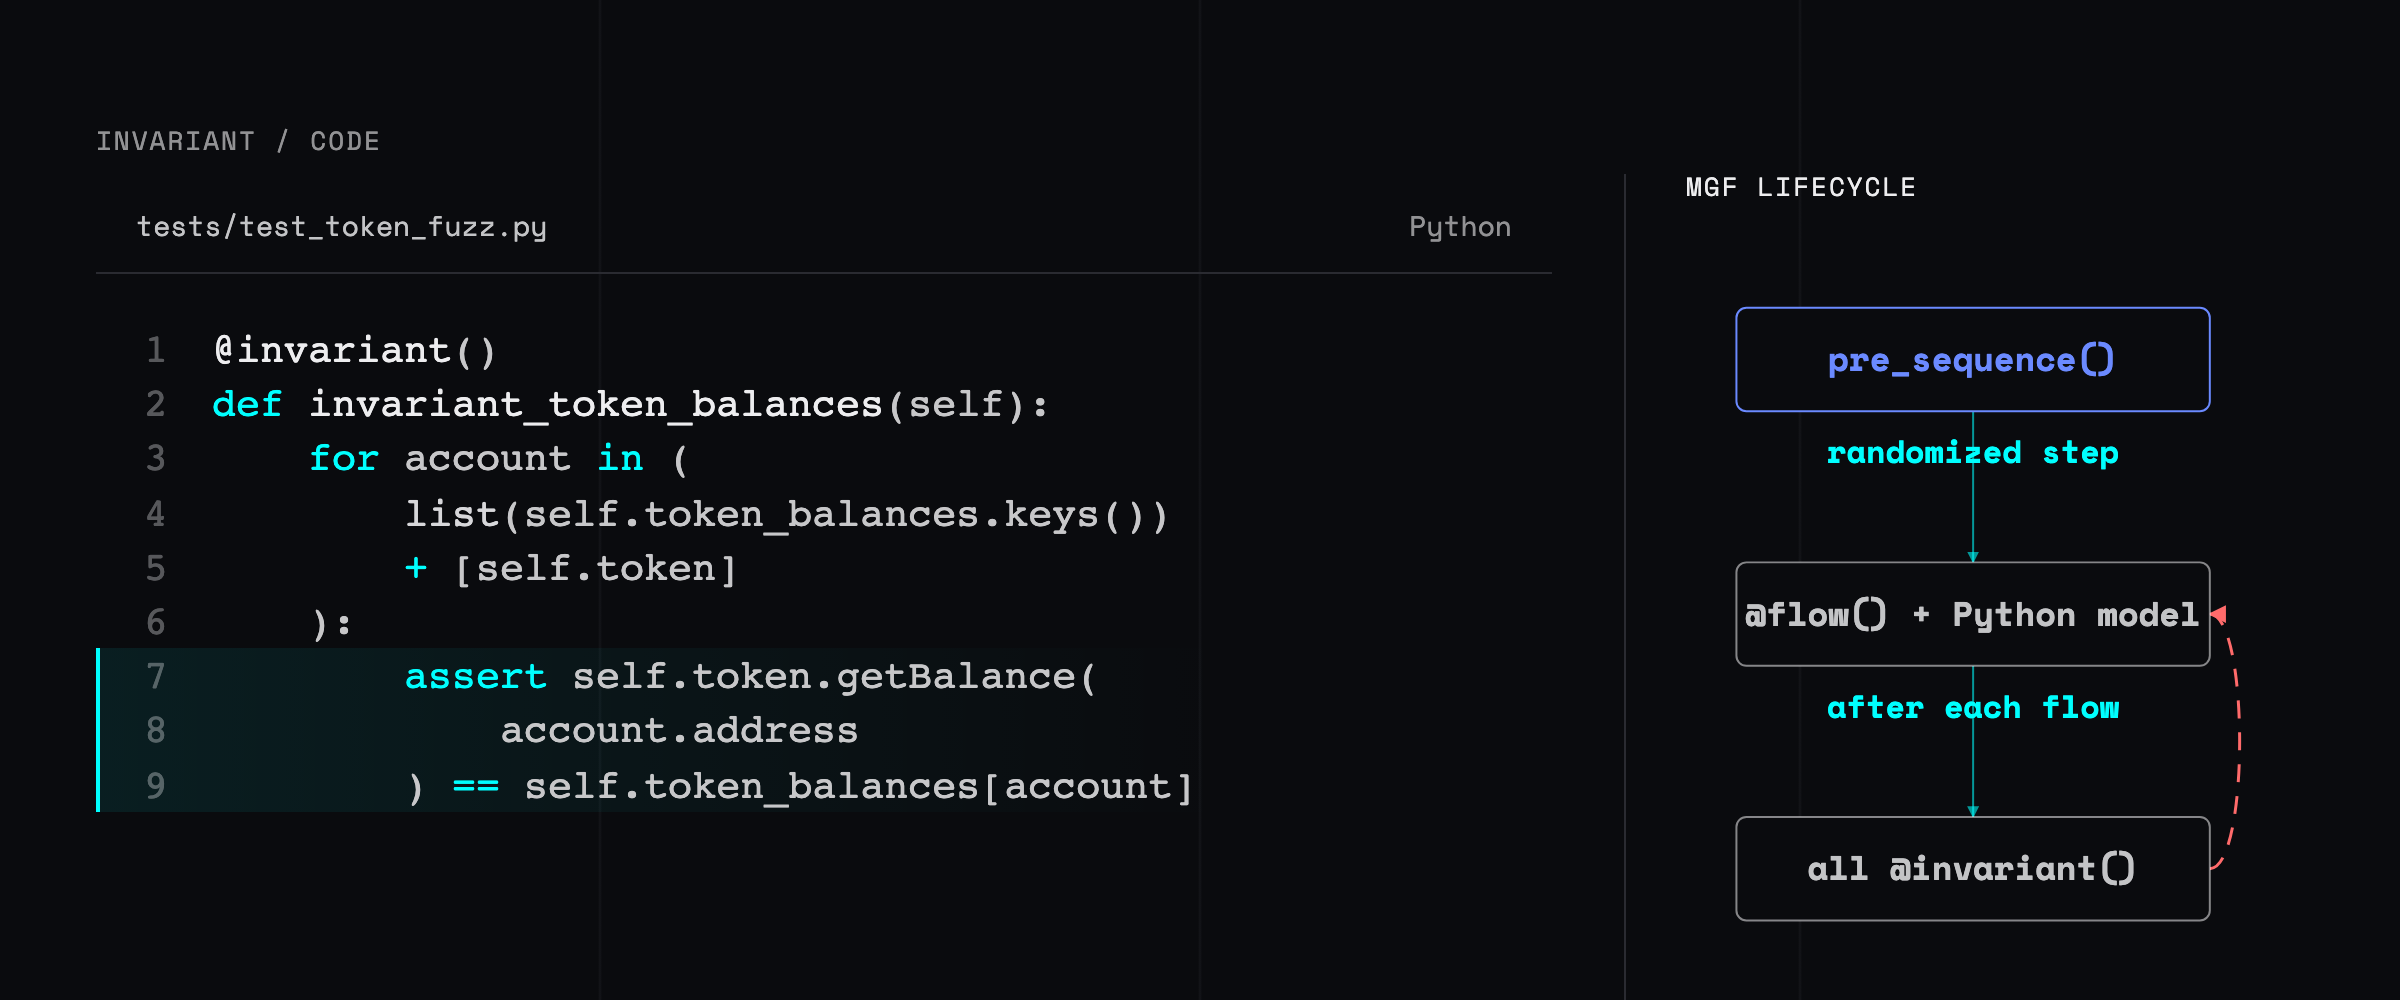
Learn Manually Guided Fuzzing (MGF) with the Wake framework to find critical smart contract vulnerabilities through systematic testing and defined invariants.
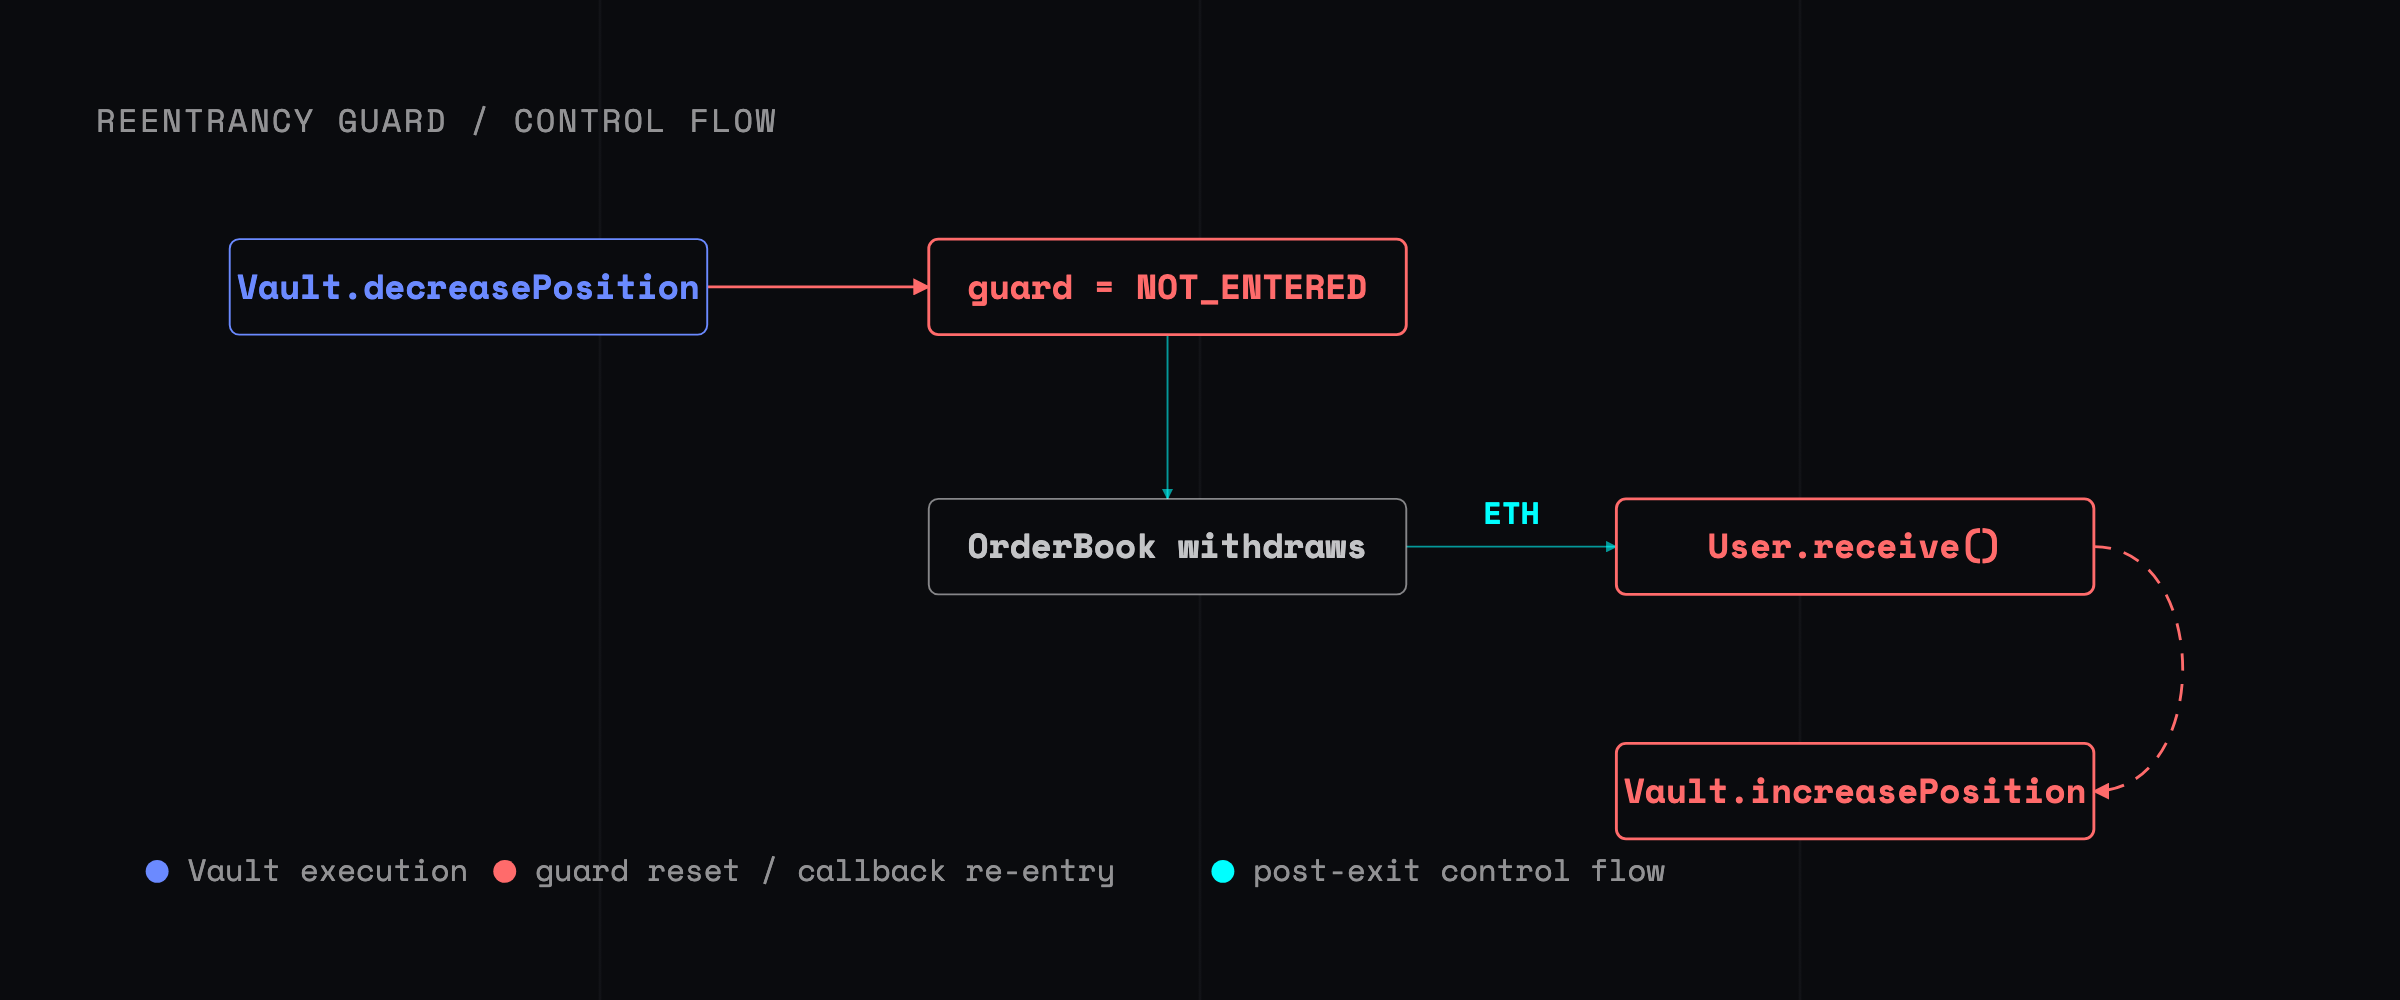
This analysis examines the 42M attack on the GMX protocol. We provide details of the vulnerability with a working reproduction of the attack scenario.
![The vulnerable Vault withdrawal code beside a recursive call-stack graph showing repeated withdraw frames reading the same balance before any frame reaches balances[msg.sender] equals zero.](/_astro/hero.BjCEFGsd_2u77Pn.png)
What is a reentrancy attack? A reentrancy attack is very specific to smart contracts due to the nature of external calls. When a contract interacts with another…